Light Density & The Truth about Pods/Beds
In the world of PBM (Photobiomodulation) pods, light intensity, also known as fluence (measured in mW/cm² or W/m²), plays a crucial role in determining treatment effectiveness. Because of this, it’s also one of the most exaggerated and manipulated claims in marketing. From our recent work with military organizations, we’ve discovered that many manufacturers overstate their performance, and in some cases, by a lot. One well-known brand, for example, was found to deliver less than 25% of the fluence they advertised. That’s a serious red flag.
Always Test Before You Invest
With systems costing upwards of $60,000, it’s critical that buyers validate any claims with real measurements. High-fluency systems do cost more, but they also deliver significantly faster results. That’s why nearly every manufacturer markets their device as “the most powerful pod”, regardless of whether it’s true. As an engineering-first company, we test everything, including our competitors’ products, and we can back up our performance with actual data.
Light fluency is grounded in physics and measurable science. There are two kinds of test equipment: inexpensive relative meters (like solar output sensors), which are useful for spotting false claims, and high-precision absolute meters, which provide calibrated, wavelength-specific measurements. While relative meters won’t give you lab-grade accuracy, they can quickly expose inflated marketing. On the other hand, with the proper tools and protocols, you can measure light fluency within 3% of its true value.
Another key point: the ReGen Pod delivers full-body fluence evenly across the entire treatment area. By contrast, most panels or single-sided beds may appear intense, but they only cover about 5% of the body at one time. To compensate, users of low-coverage systems may need up to 20 times longer per session to get a comparable dose.
With the ReGen Pod, a typical session lasts just 15–18 minutes. Achieving the same effect with underpowered systems could take 2–6 hours daily, something few users or clinics can realistically maintain.

Absolute vs. Relative Light Measurements
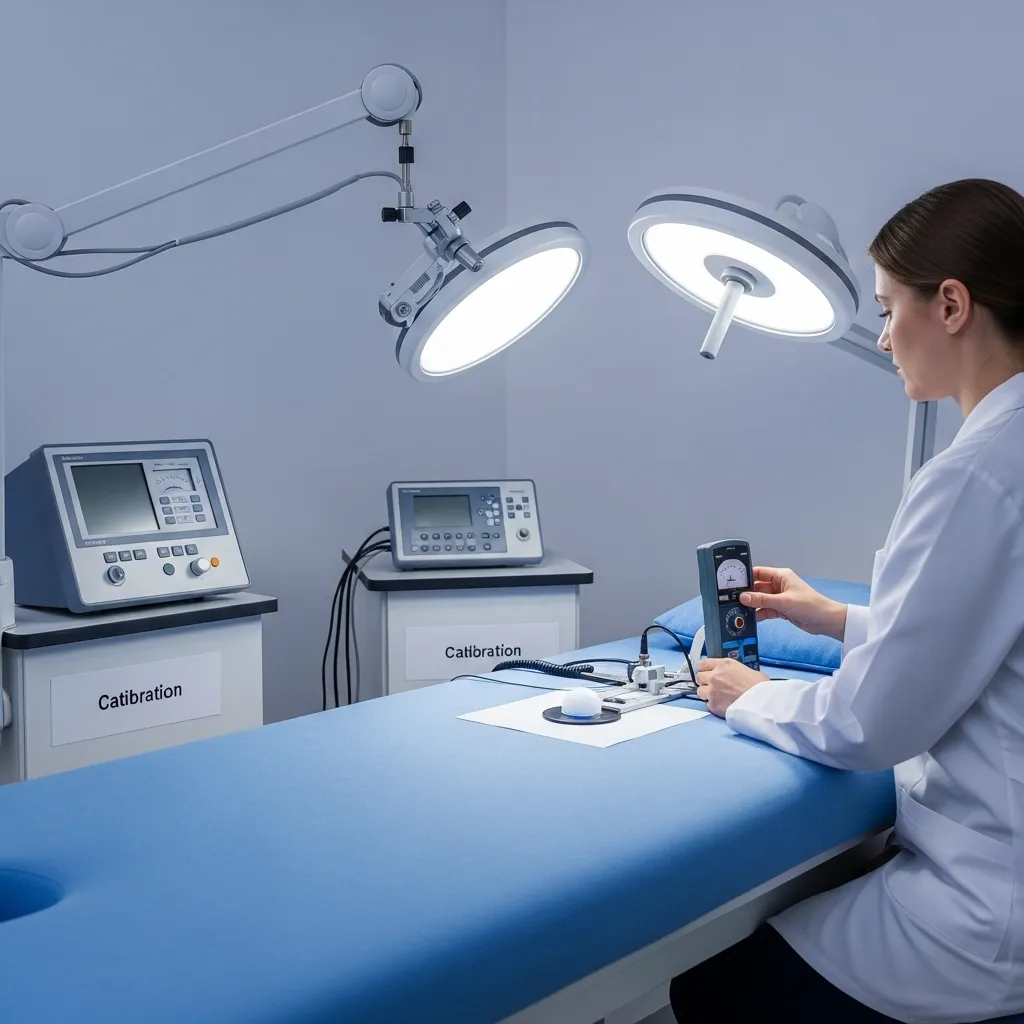
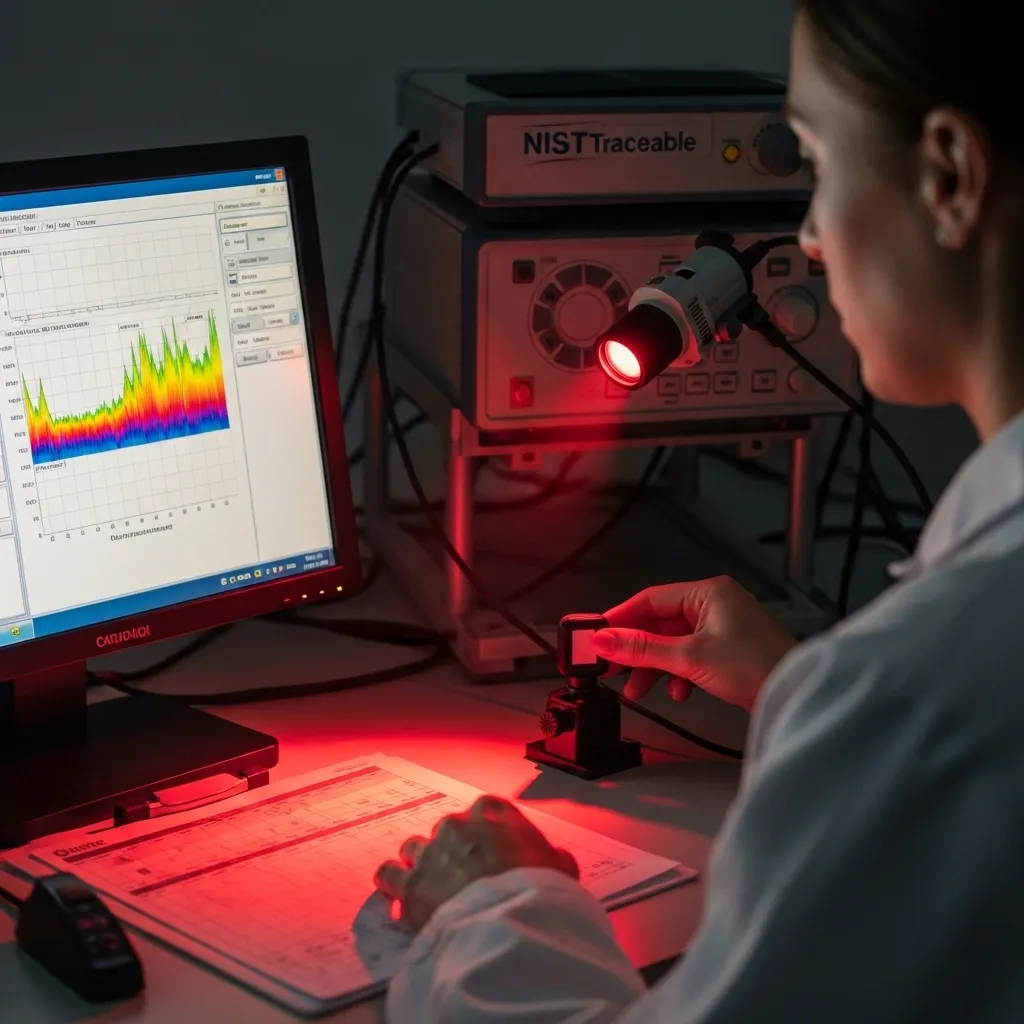
When it comes to measuring light—or any physical property—there are two types of results: absolute and relative. To get accurate absolute readings, light sensors must go through a rigorous calibration process. Once a sensor is built, it needs to be tested against certified, NIST-traceable light sources to account for any inconsistencies in how it responds across different wavelengths.
The electronics inside the meter are then adjusted to correct for these variations, allowing the device to deliver consistent and reliable measurements. However, it’s not enough to calibrate just once or use a generic light source. Calibration must be performed using wavelengths that closely match the ones used in the actual application. Otherwise, the meter may fail to correct for the physical limitations of the sensor, and your readings could be inaccurate.
This is why professional-grade, calibrated meters are critical for getting true “absolute” light measurements, especially when precision matters.

Essence of Calibration
The key to turning a relative light reading into an absolute one lies in calibration factors. These factors are created by testing the light sensor against certified NIST-traceable light sources at wavelengths that closely match those used in your PBM system. Since each wavelength—or wavelength range—interacts differently with the sensor, each one requires its own correction factor.
High-quality testing equipment comes with a calibration report showing these specific factors, which are used to adjust for the sensor’s natural variances. In the red to near-infrared (NIR) range, common in PBM pods, these calibration factors can vary significantly, often between 1 and 4. That means, without proper calibration, your readings could be off by as much as 400%.
In short, if you’re not using calibrated equipment with accurate correction factors, you’re not getting trustworthy data—and that can lead to poor decisions about system performance and dosage.

Fluency and Dosage
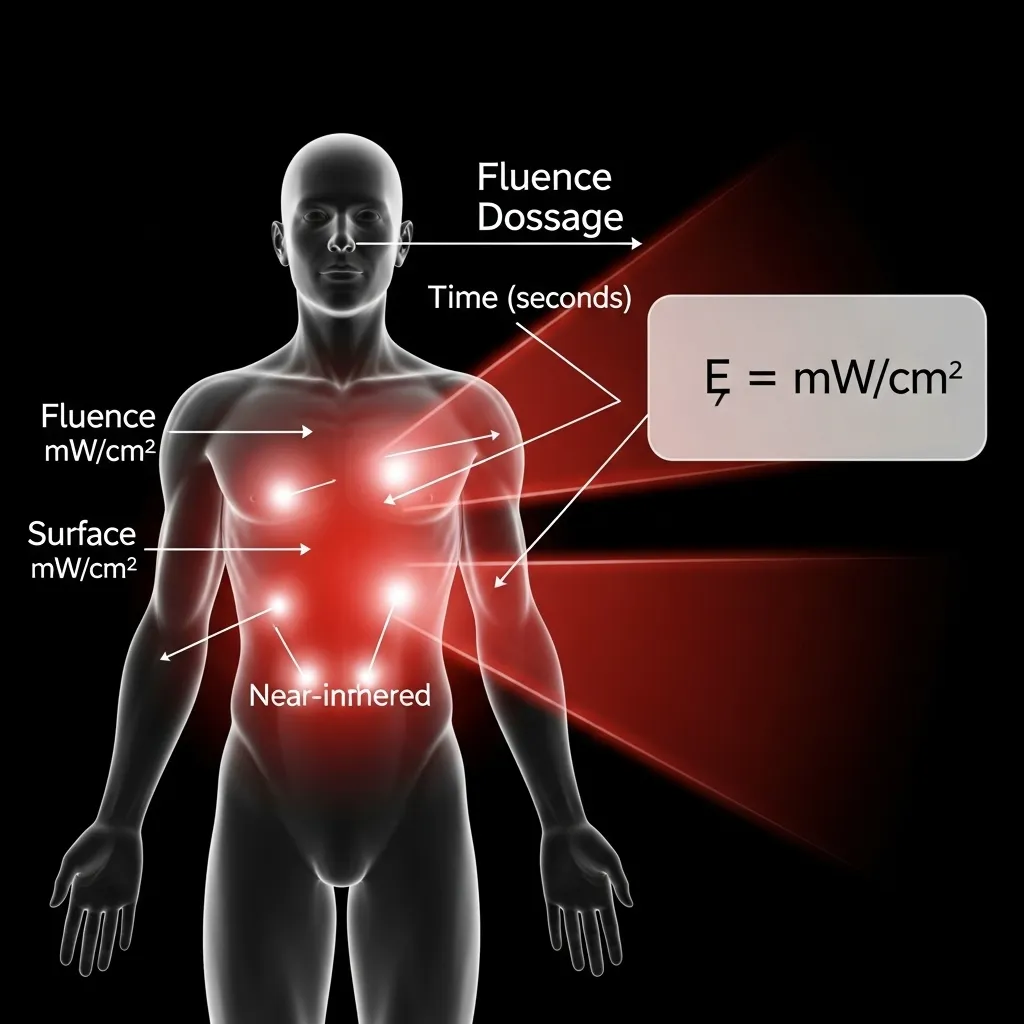
Fluence (or light density) is a key measurement in Photobiomodulation (PBM) because it directly affects the dosage, and just like with medication, the right dosage determines the outcome. Fluence is typically measured in mW/cm² (milliwatts per square centimeter) or sometimes W/m².
The formula to calculate total energy (or dosage, in joules) delivered to the body is:
Total Dosage (J) = Fluence (mW/cm²) × Surface Area (cm²) × Time (seconds) ÷ 1000
To put this into perspective, Harvard research shows that the average adult has a body surface area of around 18,000 cm². And since 1 Watt (or 1000 mW) delivers 1 joule per second, it becomes easy to see how fluence levels significantly impact the total treatment dose.
This is why comparing fluence across light systems is so important—higher fluency means more energy delivered in less time, and ultimately, more effective PBM therapy.
Analysis
Measuring Light Accurately in PBM Pods: Precision vs. Reality
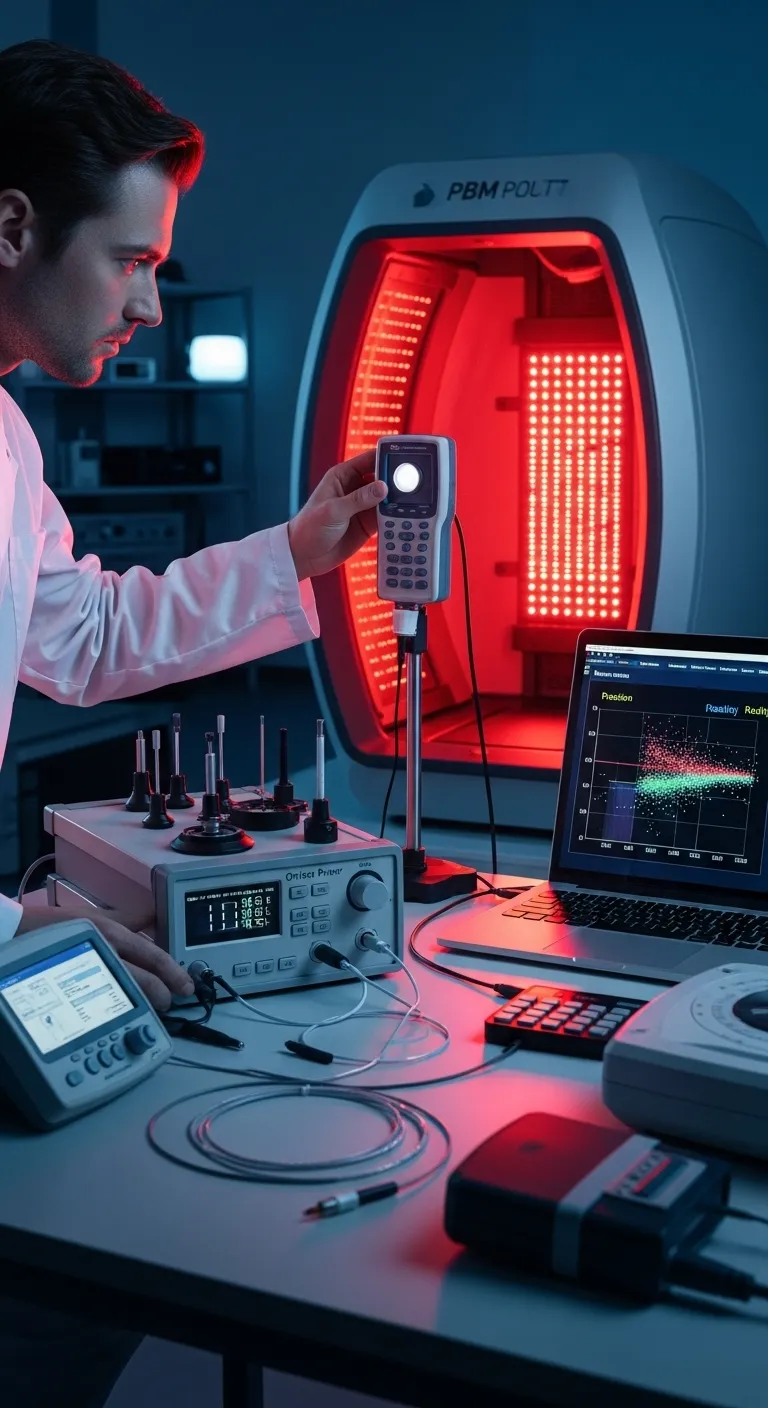
Accurate light measurement in the PBM range isn’t just important—it’s essential. Fortunately, there are professional-grade light meters specifically designed to work within the red and near-infrared wavelengths used in PBM pods. When used properly, these tools can provide highly accurate readings, with error margins as low as 3%.
To achieve this level of accuracy, each wavelength group must be tested individually, applying the correct calibration factor for that specific range. If you try to apply the correction factor for 630nm light to a 940nm reading, for example, you could be off by as much as 400%, because the sensor responds very differently across the spectrum. This is a major challenge with lower-end pods, which typically don’t offer individual wavelength control, making accurate, full-range measurements virtually impossible.

At REGEN RED, we rely on industry-leading tools: the Ophir Starlight power meter paired with the 7Z02410 (PD300) sensor. This setup measures from 430nm to 1100nm, and delivers 3% accuracy within the 400nm–980nm range, exactly where PBM systems operate. This professional setup costs between $2,000–$3,000 and is widely trusted by researchers. Our measurements have even been audited and verified by an independent third party, which is why we confidently refer to this as the gold standard in PBM light measurement.
Want to see the data?
We’re happy to share our detailed measurement reports upon request. Due to legal constraints, we can’t publish them publicly, but feel free to reach out directly.
Can’t Afford a $3,000 Meter? Try a Relative Reading Instead
If a precision-calibrated meter isn’t accessible, you can still get rough comparative data using a low-cost solar power meter—available for under $150. While these devices won’t give you absolute accuracy, they can be useful for comparing similar pods running similar wavelengths. Keep in mind, this method won’t tell you the exact fluence, but it can help you detect when a manufacturer is grossly overstating their system’s output.
In our own independent comparisons, we tested a range of PBM pods using three different “relative” light meters:
- TENMARS TM-206 Solar Power Meter
- TES-1333 Solar Power Meter
- Sanwa LP10 Laser Power Meter
Please note:
- The solar meters report in Watts per square meter (W/m²)
- The Sanwa LP10 outputs in milliwatts (mW) without specifying area
So, while these meters are not cross-compatible for exact values, they still offer useful relative performance insight between systems.
Want to Know How REGEN RED Stacks Up?
- The light meter readings for various systems
- And a follow-up table showing the performance gap between REGEN RED and its competitors
These relative measurements, though not lab-grade, offer a revealing look at the real-world differences in power output that buyers rarely see.
Typical Relative Light Measurements
| Light Pod | Tenmars (mW/cm2) Max | TES (mW/cm2) Max | Sanwa (mmW) Max | Sanwa (mmW) Min |
| REGEN RED | 70.6 | 69.8 | 23.28 | 19.46 (84% of Max) |
